Intraday Page Overview

NeoTrader
Last Update 5 years ago
INTRADAY TRADES
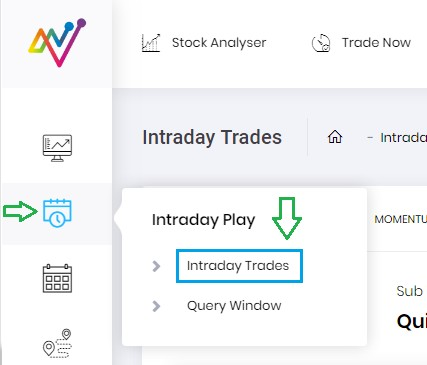
Toggle to the second icon after the NeoTrader Opening page loads and click on Intraday Trades.
This module provided in‐depth detail of Trades generated by NeoTrader Application for Intraday Traders (Intraday and BTST) with Performed Strategy, timeframe, Entry, Exit, Stop Loss, Trailing Stop, etc. Hence, the user can fine‐tune and revise his approach to a greater level of details.
This Module has two different Segments:
1. Intraday Trades Filters
2. Intraday Trades Results
Intraday Trades Filters
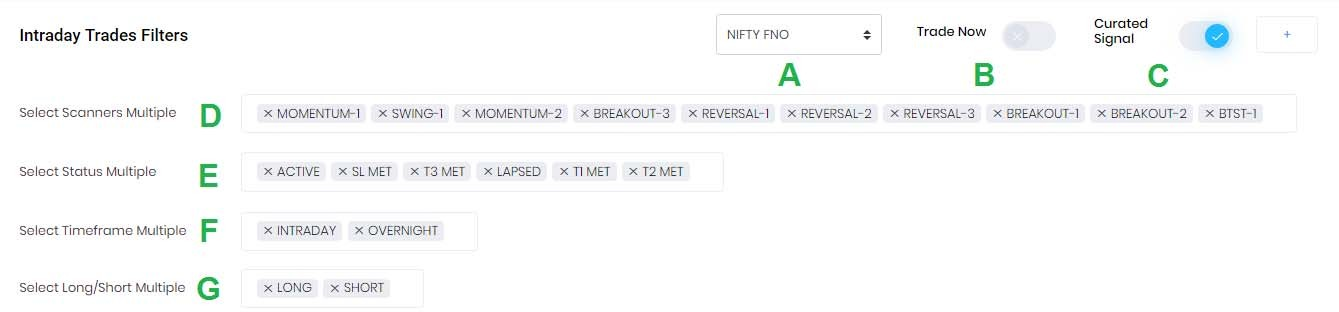
A – User can select the group of stocks from the drop down menu on which he/she wants NeoTrader to generate the trades. The current universe comprises of Nifty50, Nifty Next 50, Nifty Bank, Nifty Mid‐ Small, Nifty FnO and Watchlist. See the details on Watchlist page on how to proceed.
B – Trade Now is a feature to filter the trades that are active at the moment and can be traded right now.
C – Curated Signal is a filtration technique used to filter recommendation based on technical parameters to ensure results shown have higher probability of success.
D – User can filter the Trade results by selecting one or multiple strategies according to their analysis. NeoTrader highlights various types of strategies that have been Designed and Back‐tested. Most of the strategies are covered across different sets of webinars / training workshops that Chart Advise has conducted. The strategies are based on Momentum, Pullback, Breakout, Reversal and BTST.
E – User can filter the history of the trades according to the status that was achieved after the trade was recommended by NeoTrader. The Results will be filtered to match the criteria as per the input by User. The algorithm monitors the health of the trade and assigns different labels to immediately alert the user at every refresh. User needs to be aware of the following types of status labels.
- Active – Trades that are activated now
- SL Met – Trades that triggered stop loss level
- T1 Met – Trades that met First Target
- T2 Met – Trades that met Second Target
- T3 Met – Trades that met ALL Targets
- Lapsed – Trades that were initiated but did not achieve even T1 nor triggered stop loss
F – The recommendation that is generated through the process can have the potential for higher levels of target and thus timeframe may have extended towards overnight position. Here, User can select between Intraday and Overnight to filter the result section.
G – This filtration helps User to select based on which side of the market he / she wishes to review the trades i.e., Long or Short.
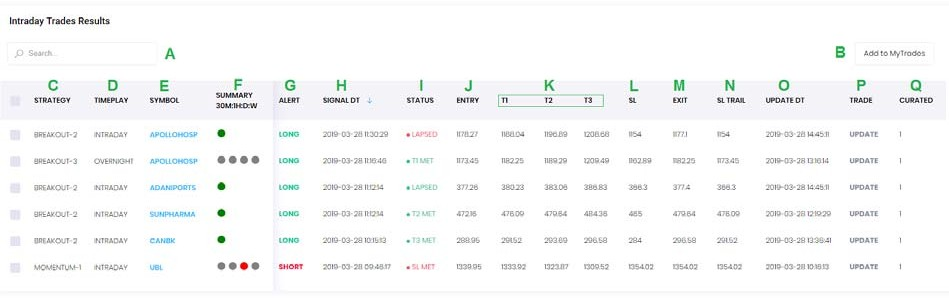
A – Search Function allows user to type in the name of the symbol / strategy and check if trades has been generated matching the criteria. This also helps User to watch history (generated trades) of particular input (Stock / Strategy).
B – Add to My Trades allows user to transfer the selection to My Trades section so that user can keep track of all the progress / updates.
C – Strategy highlights the method that was used to generate the trade.
D – Timeplay is the indication of holding period for the trade recommended – Intraday (Position to be squared off at the end of the day) or Overnight (Carry forwarded position towards next day. This timeplay specially comes when trades are generated during the second half of the session or with BTST strategy).
E – Symbol is acronym for the security as defined by NSE / BSE.
F – Summary shows if there is a Buy or Sell Signal in that security across 30 min / 1 Hourly / 1 Day or 1 Week. Through these simple and powerful 4 circles, User can identify how the stock is placed for a trade.
Grey Circle indicates neutral status in that timeframe
Green Circle indicates buy in that timeframe
Red Circle indicates a sell status in that timeframe
When it’s a Red or a Green circle with a black outer rim it highlights that a signal (Buy or Sell) has been generated in that timeframe
G – Alert shows what kind of signal has been generated – Long (Buy) or Short (Sell)
H – Signal DT shows the date and time of the signal generation.
I – Status shows the stage at which the trade is, post the current data refresh. Types of status labels:
- Active – Trades that are activated now.
- SL Met – Trades that triggered stop loss level.
- T1 Met – Trades that met First Target.
- T2 Met – Trades that met Second Target.
- T3 Met – Trades that met ALL Targets.
- Lapsed (Green) – Trades that were initiated but did not achieve T1 or triggered stop loss and to be exited with nominal Profit.
- Lapsed (Red) – Trades that were initiated but did not achieve T1 or triggered stop loss and to be exited with nominal Loss.
J – Entry is the price at which the trade is initiated based on the mentioned strategy.
K – T1 (First Target), T2 (Second Target) and T3 (Final Target) are the targets that are expected to be achieved.
L – SL (Stop Loss) is the price which if triggered leads to Exit of the trade.
M – EXIT is the price where an active trade needs to be exited.
N – SL TRAIL is part of risk management. As the recommendation continues in the direction of the trade and reaches the first level of resistance, the stop loss is trailed to reduce the amount of risk carried.
O – UPDATE DT is the last update processed time for the trade recommendation. The updates are shown in Status.
P – Trade indicates whether the recommendation has been processed as part of fresh trade or an Update to the earlier trade generated. If column has value “NOW”, then it is fresh trade generated while “UPDATE” shows the review towards the trade generated earlier.
Q – CURATED has a value of ‘0’ or ‘1’ based on whether filtration parameters have been applied or not. If the column value is ‘0’, there is no advanced filtration Algo used in generation of trade while if the value is ‘1’ then the advanced filtration technique is applied.