Key Technical Indicators
ALL ABOUT KEY TECHNICAL INDICATORS.

NeoTrader
Last Update hace 5 años
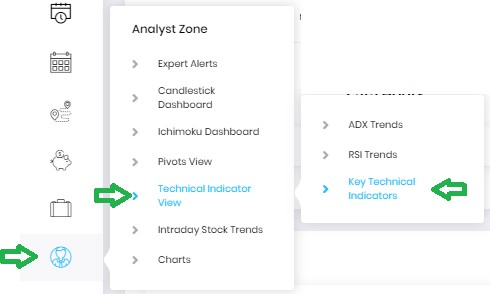
The “Key Technical Indicators” page in placed under the “Technical Indicator View” in Analyst Zone section.
This page is divided into two different sections:
- TimeFrame View
- Symbol View
TIMEFRAME VIEW
This section of the page focuses on collective information of all stocks filtered across based on the universe of stocks and the timeframe. All major technical indicators are covered into a tabular form. A detail of the page is as below:
MENU

A: UNIVERSE - USER can choose the Universe desired from the drop down menu (default is set to F&O list). The dropdown also consists of Watchlist (See watchlist page for more details).
B: TIMEFRAME - One can click through ‘30 Mins’, ‘60 Mins’, ‘1 Day’, ‘1 Week’ and ‘All’ together to see results based on those periods. This enables users to do multi timeframe analysis and caters to different timeframe market participants.
C: SEARCH – This Function allows user to type in the name of the symbol and check all the parameters at one go. This result for this function can be enhanced once used in Symbol View.
RESULT
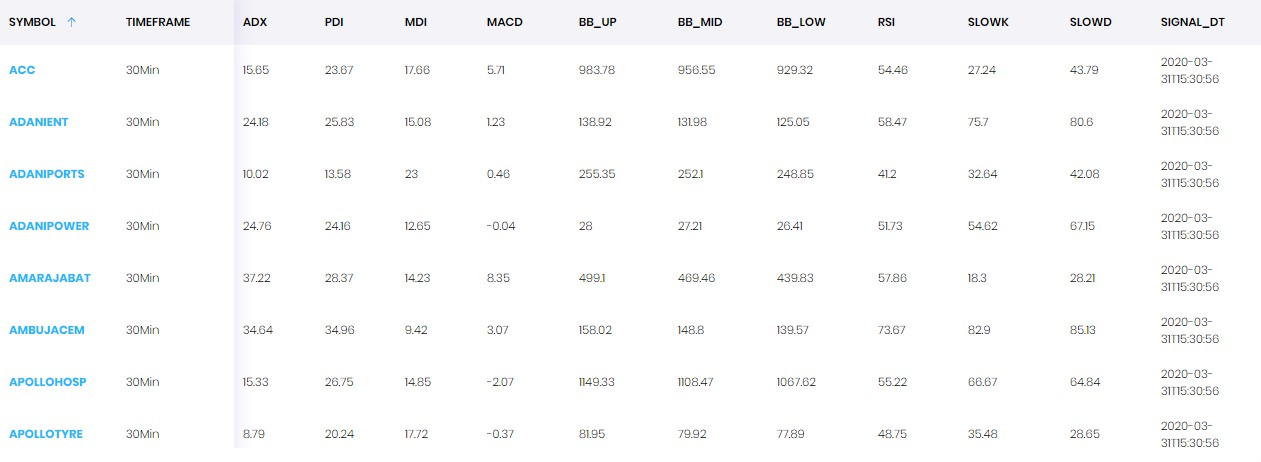
The result section shows majorly used technical indicator values for all the stocks (selection based on the universe) for the timeframe (selection through the menu). These can be bought to a multi timeframe analysis, if someone has selected “ALL” in the timeframe menu dropdown.
The lists of Indicators / Oscillators used are: ADX, MACD, BOLLINGER BAND, RSI and STOCHASTICS.
One can click on the heading to sort by value and find stocks that are above or below a particular value.
These values are updated exactly after the selected period is over. For eg., 30 Mins values will be updated after the candle close of 30 Mins. As Market starts at 9:15, the candle close at 9:45, 10:15, 10:45 and so on is considered.
SYMBOL VIEW
Symbol view presents a tabular form of the result for any particular stock / index input by the user. Here, one can focus on a particular stock / index rather than a bunch of stock.
SEARCH
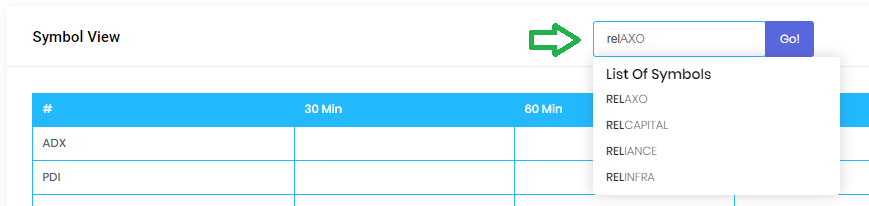
The User input box accepts stock name and the matched inputs are shown below in the drop down. The desired stock / index name can be selected by user. Then, on pressing “GO”, the table below gets populated with the results for particular input stock / index.
RESULT TABLE
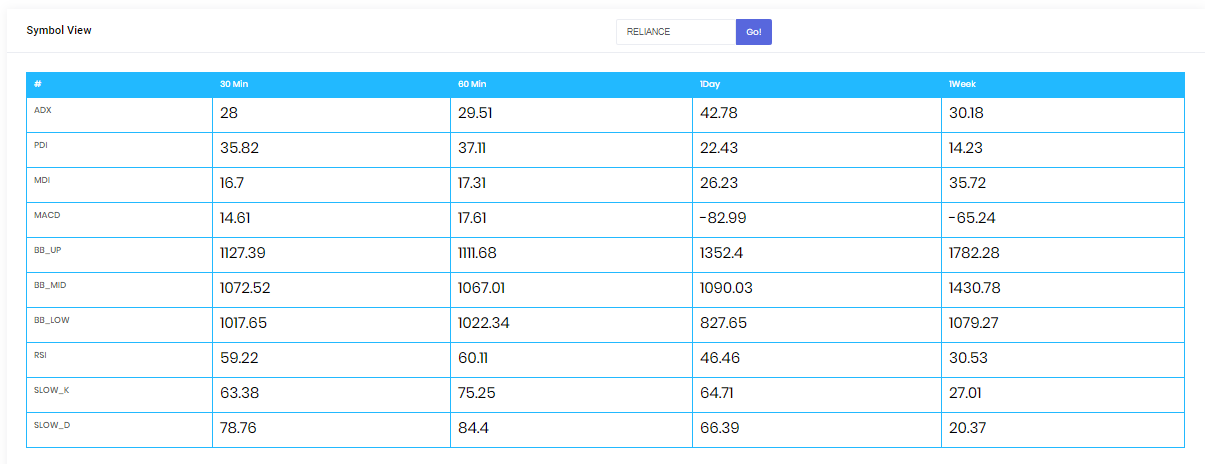
The result section here is into tabular form focussing on a particular stock / index. After the input by USER, the result shown in the table consists of all the above discussed Indicators / Oscillators (ADX, MACD, BOLLINGER BAND, RSI and STOCHASTICS) values into a multi timeframe dimension. This helps one to get detailed information without referring to chart and helps in making decision whether the confirmation is for Intraday, Multiday or Positional.
Considering the above table for Reliance, let’s see how to read the values quickly
- ADX on all timeframe is trading above the neutral zone of 25 and hence is considered to be trading with strength.
- PDI on 30 Mins and 60 Mins are in trend while in 1Day and 1Week below neutral shows no positive trend.
- MDI, on the other hand, shows trend in 1Day and 1Week shows bearishness in higher timeframe.
- Thus, combining the ADX studies, it is seen that, one should be bearish on higher timeframe while some bullish action is expected in lower timeframe. Those who have long positions should book profits to the nearby resistance while the multiday and positional participants should utilize this for a short signal.