RSI Trends

NeoTrader
Last Update 5 years ago
RSI TRENDS
RSI Trends page is designed to help you get clarity on how to measure the change in price momentum. It is a leading indicator and is widely used to strengthen or weakness of a stock or market based on the closing prices of a recent trading period.
On this page, the RSI is shown in two different formats HeatMap and Dashboard & Levels
Section 1- Heatmap
HeatMap summarizes the RSI readings of each security from the respective universe selected. The readings are analyzed for the all the timeframes and the ongoing trend is displayed for each timeframe.
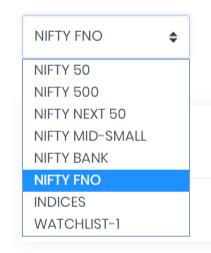
The default universe for RSI readings is NIFTY FNO. The universe can be changed by drilling down to the universe of your choice. You can also select your own watch list on which the RSI Algos can be executed to get the HeatMap readings.
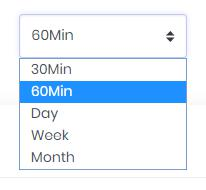
RSI readings are calculated for various timeframes as shown in the dropbox. The default timeframe is 30 min, which a user can change as desired.
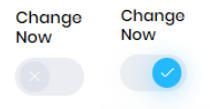
While intraday trading if a user wishes to know the stocks that are displaying some action as he is on the screen he needs to enable the “Change Now” toggle as shown above. This will only reflect the most recent immediate names and as long as they continue to meet the criteria set as per the algo.
TIMEFRAME
To ensure that there is clarity while understanding the RSI readings there are five circles placed beneath the name of each security.
HeatMap displays the RSI readings for 5 Timeframes (30 min / 60 min / Daily, Weekly, and Monthly) as small circles. The circles are having 4 colors, Green as Bullish, Red as Bearish, Black as Neutral, and White as Non-Computed. Each circle represents one timeframe and should be read from left to right beginning with the lowest
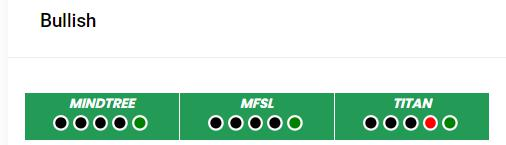
The above list is from the Nifty FNO universe and has appeared under the Bullish tab as all the stocks are bullish on Monthly timeframe. For e.g : MINDTREE RSI readings show that the trend is neutral in all timeframes except Monthly where its Bullish.
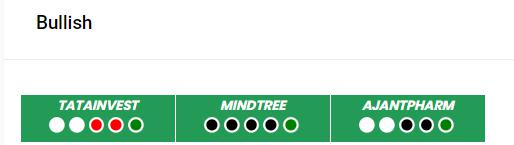
The above list is from the Nifty 500 universe and has appeared under the Bullish tab as all the stocks are bullish on Monthly timeframe. For e.g : TATA INVEST RSI readings show that the trend is Not Computed for Intraday, Negative on Daily and Weekly while Bullish on Monthly.
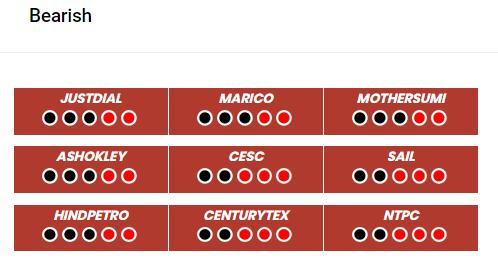
The above list is from the Nifty FNO universe and has appeared under the Bearish tab as all the stocks are bearish on Monthly timeframe. For e.g : JUSTDIAL RSI readings show that the trend is Neutral on Daily and Negative on Weekly and Monthly.
Section 2 – Dashboard & Levels
Dashboard & Levels are designed to display readings for different timeframes for the entire universe. This page also provides users flexibility to design their own query based on RSI readings. Along with that, there is also a possibility to observe the RSI Levels which was not possible in the HeatMap page.
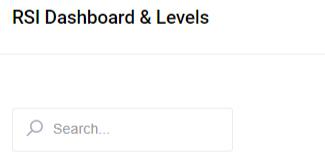
In case you wish to see the RSI readings for a specific stock you can type the first three alphabets of the symbol as mentioned in the NIFTY 500.
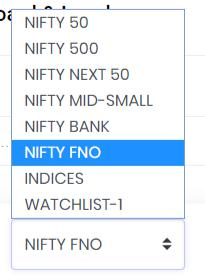
The first step would be to select the particular pre-defined universe from the dropdown box as shown. One can also create watchlist of preferred stocks on which the Algo could be executed before being showcased for trading / investing.
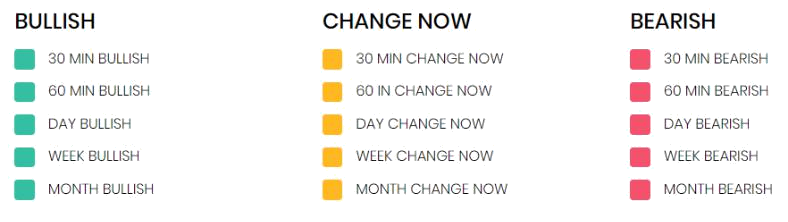
There are three sections under Dashboard available to the user for building the query.
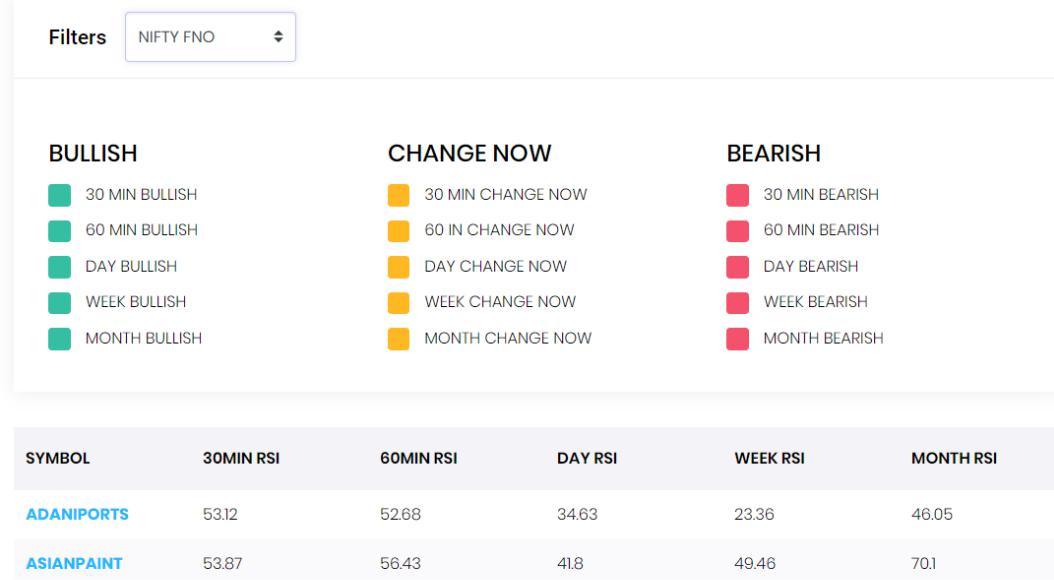
This is the default screen in Dashboard where the results for all the NiftyFNO stocks are available for all the timeframes.
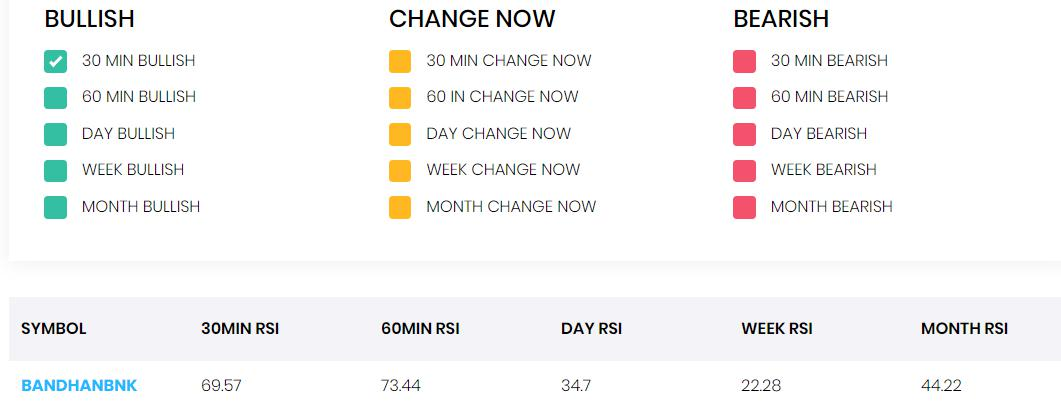
By selecting a row under the Bullish section you will see only stocks which satisfy the criteria.
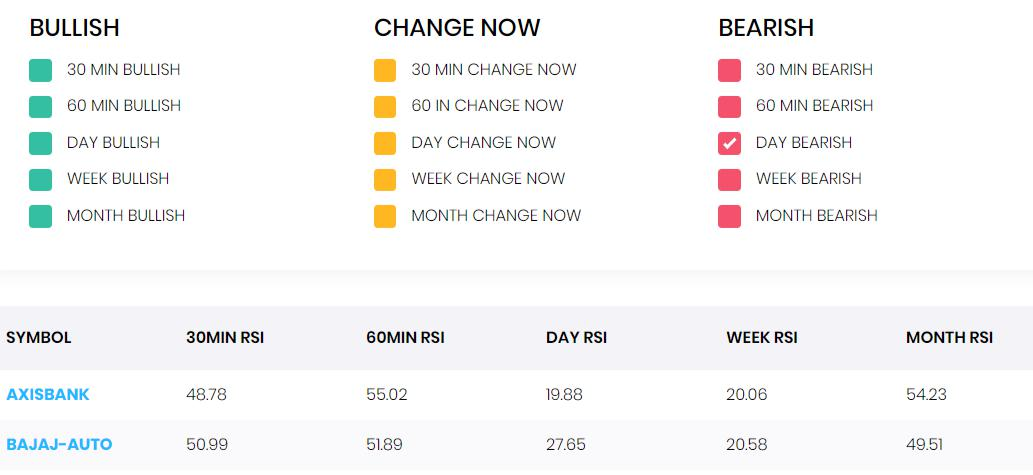
By selecting a row under the Bearish section you will see only stocks which satisfy the criteria.
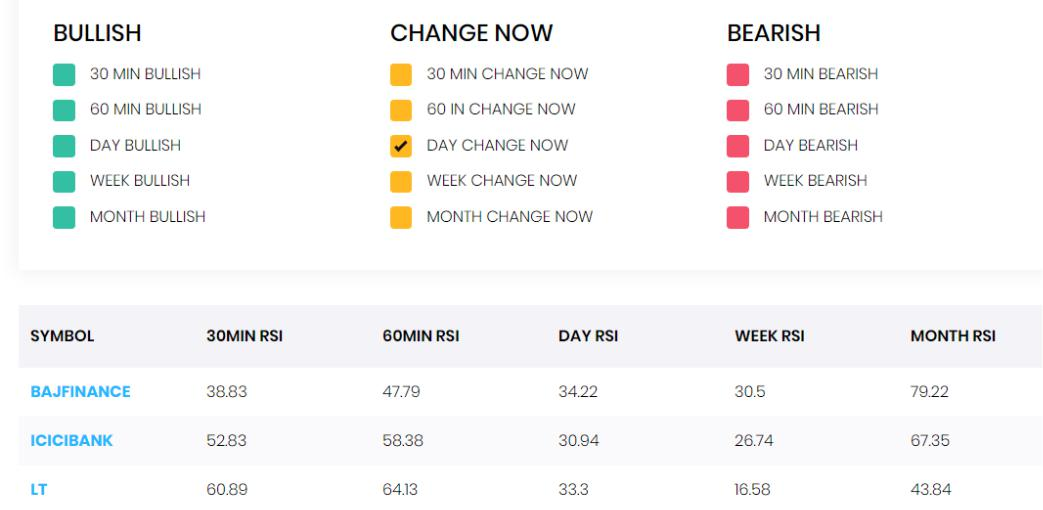
By selecting a row under the Change Now section you will see only stocks which are displaying some action at that moment.
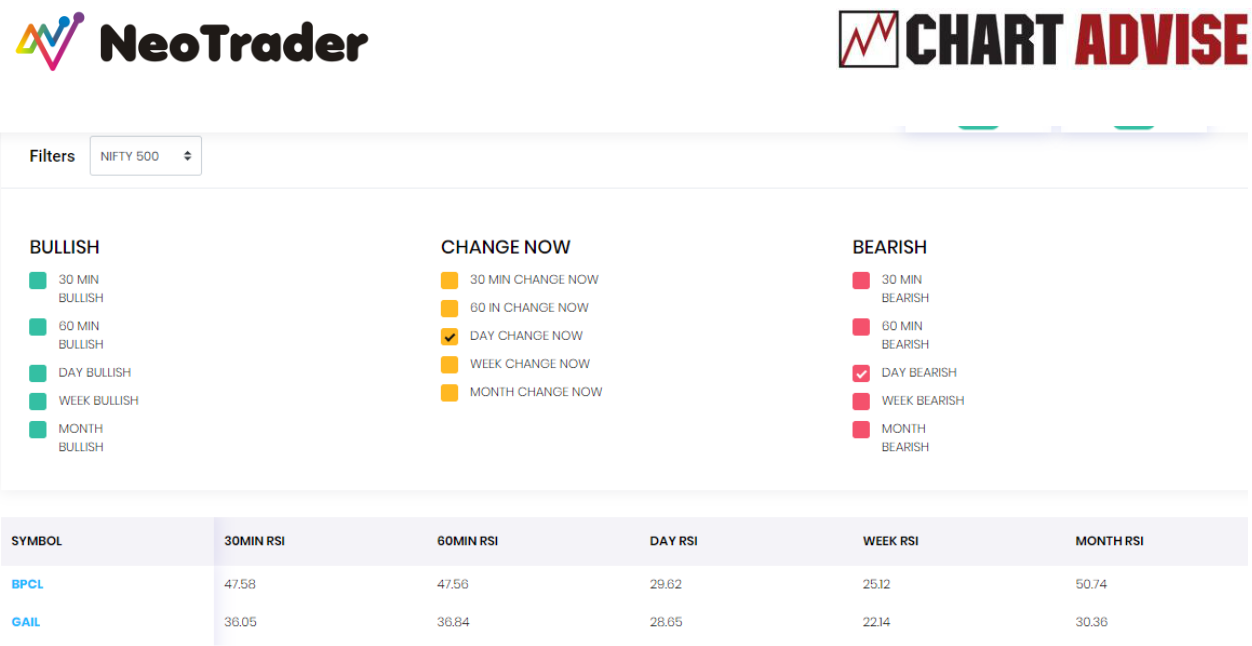
By selecting a row under the “Change Now” and “Bearish” sections you can build a query that will display stocks that are satisfying criteria under both sections.