Stock Analyzer

NeoTrader
Last Update 5 χρόνια πριν
Stock Analyser is situated on the Top Left corner of the window adjacent to the logo. User can click and the page navigates to the details.

Stock Analyser is consolidated and summarised view that provides overall information for an instrument (Stock / Index). One can enter the symbol in the enter symbol box and press go to find the details below (Nifty details are shown by default). One can also avail the "See Chart" option to view EOD charts for a particular instrument in a new window provided by Trading View.

Further, The Stock Analyser is divided into different view like Intraday, Multiday, Positional, Investment, and Consolidated based on the time frame of the Trader/Investor. Here, the User can choose the desired view and find details of the symbol selected for detailed information that is generated by the scanner.

Every view is further divided into subgroup that are common in Intraday, Multiday, and Positional:
Header: This provides information on Day Change, Weekly Change, Monthly change and Year to Date change which remains constant on all views and the values change based on the performance of the symbol selected.

Momentum/Trend and Reversal/Trend Exhaustion: These two dials show the sentiment of the symbol movement and indicate the Strong Buy, Neutral, and Strong Sell signal. For Eg, if a symbol shows strong buy-in Momentum/Trend and shows neutral in Reversal/Trend Exhaustion is showing continuity in the ongoing rally and higher targets can be achieved.
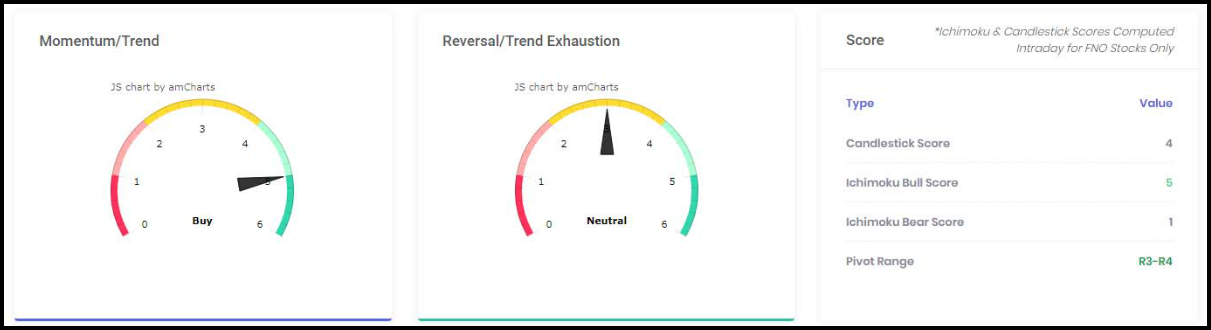
Score: Different set of filtration techniques combined provides a summed value of the symbol performance based on Candlestick, Ichimoku, and Pivot range is shown under this category. Higher value depicts the symbol in strong bullish and vice‐versa.
Active Signals: Strategies that has been backtested generates signal during the live market session and combined all, this head provides the data whether the signal is generated or not. This head shows the outcome of the signals i.e, LONG, SHORT, and NO SIGNAL. The signals can be different in different time‐frame depending on the selection by a user.
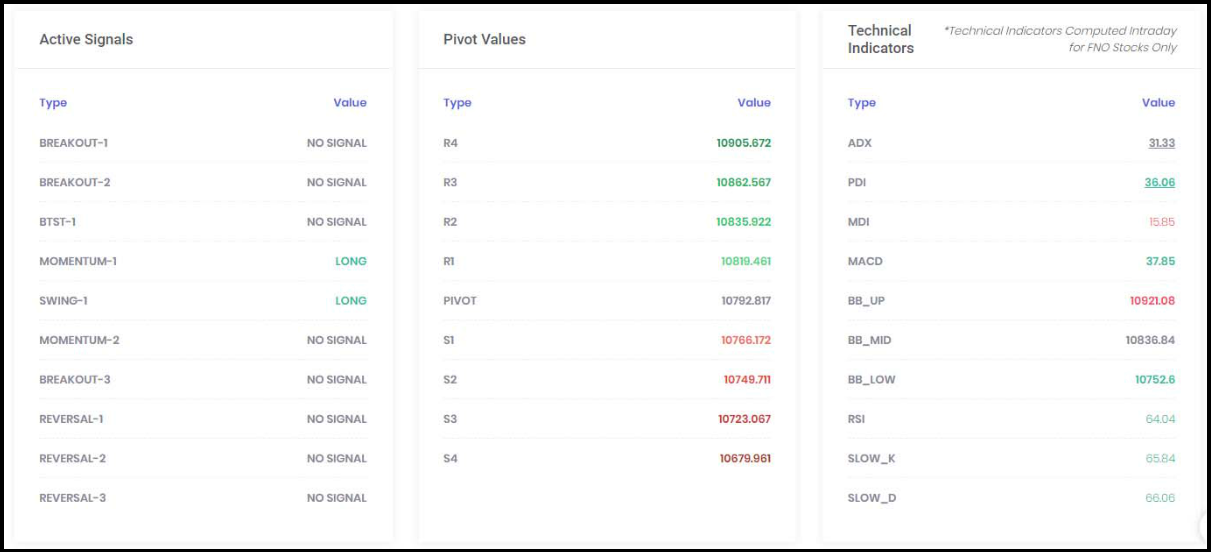
Pivot Values: Pivot values are retrieved compiling the last candle data and currently we use
Fibonacci pivot techniques to show resistance and support levels. Strength and weakness can be
determined if a symbol moves higher towards next level of resistances and supports mentioned.
Symbol crossing above R4 and below S4 generally shows symbol in strong bullish and bearish
territory.
Technical Indicators: Technical indicators are mathematical calculations based on price, volume, or
open interest of instrument that helps to predict the future price movement. List of major indicators
are covered under this section that helps understand the overall sentiment at current juncture.
CONSOLIDATED VIEW
This view combines all data provided in the timeframe structured view into one so that user can
analyse data at one glimpse. The view contains all the sub group details like the header,
Momentum/Trend, Reversal/Trend Exhaustion, Scores, Active Signals, Pivot values and Technical
indicators compared across different timeframe.