TWR Pivots
ALL ABOUT TWR PIVOTS

NeoTrader
Last Update 5 years ago
This page gives a perspective on how one can generate trend signals using the concept of TWR pivots.
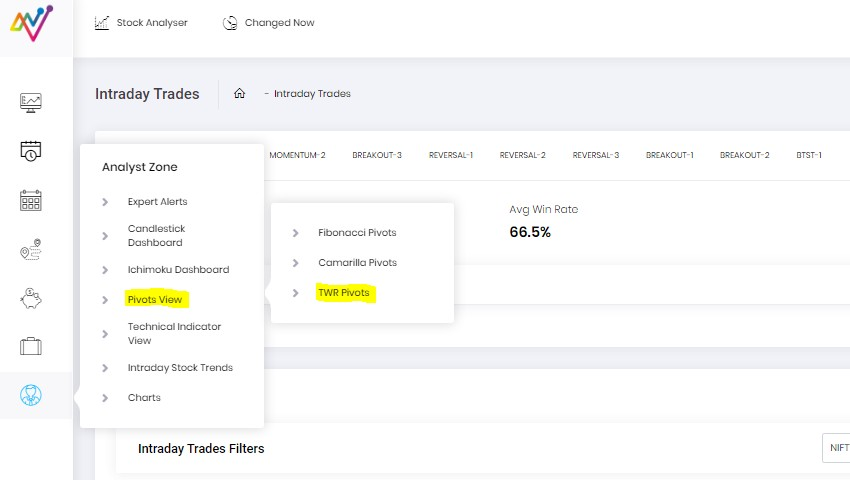
To Navigate to this page Click Pivots in Analyst Zone and choose TWR Pivots – highlighted in yellow in the below picture.
TWR EOD Heatmap
Summary page
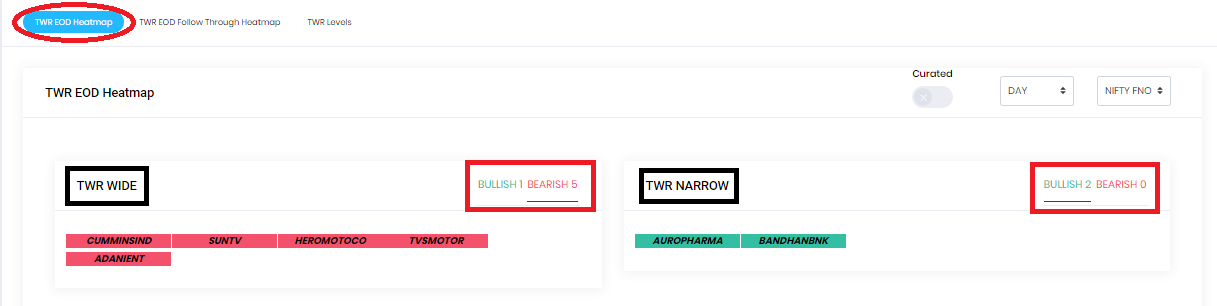
The summary stats is the first part of the page which gives a list of stocks sorted by the colour based on their trendiness – green is uptrend and red is down trend.
In the below picture you can also see two columns, TWR Wide and TWR Narrow.
TWR Wide : The stocks that are slotted into the Wide section are those that have seen some good moves recently and , since they have already displayed significant movement they are more likely to consolidate rather than continue the trend.
TWR Narrow : The stocks in this list have been in a tight and very narrow range and they have the potential to show some sort of trend for the period and maybe at the cusp of a breakout.
The whole idea is to draw the user’s attention to those stocks that are showing the best possibility of trending this does not mean that the trend will always be visible.
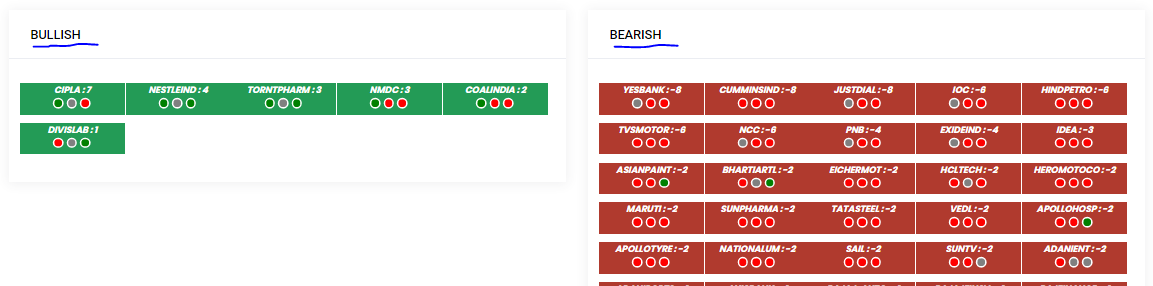
In the same section you also have a BULLISH AND BEARISH –Bullish selection lists down those stocks that indicate that the current prices are above the TWR pivot and Bearish selection gets those stocks where the current prices below TWR pivot.
Bullish and Bearish listing of Universe
On this page you have a listing of stocks the fall into either the bullish or bearish lists based on their trednliness.
TWR Counts – Scoring
The trendiness factor is assessed by adding a count, as you can see in the below image, every stock also has a count attached to it. The scores are marked with the red arrow.
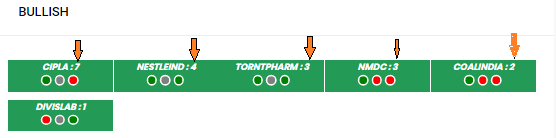
- This is the Score that is assigned to a stock. The score is created when the stock shows signs of a trend.
- As the count rises beyond 3, trendiness comes into the stock and it should be tracked for potential opportunities. As the count goes higher (beyond 12 etc), one should check the charts for some trend exhaustion signals or be ready for it.
- The tipping point is a score of 3 and above. Once the count goes above 3 or beyond -3, then you can deduce that the stock is into a trend for now. And you can start following and trading the stock in that direction.
- When TWR counts reaches extremes like +5,+6 or -5 or-6 it indicates areas of reversal
Multi time Frame Counts, watch list and Curation
The default setting for the TWE counts page is set for Daily levels, But the users can choose across time frames like Weekly or Monthly levels to check the trend status at a higher degree. The scores will change accordingly. You can check this status on Weekly and Monthly pivots also. That will give you a better idea of where the bigger trends are.
You can get the values of D/W/M TWR pivot levels for your stock of choice or a universe in a table form under Values (at the top of the screen).
If a stock is approaching the TWR pivot zone from above or below these levels will function as the first of the support or resistance level. If current price action has clearly lifted the prices above the Daily, weekly as well as monthly TWR level.
This means new momentum has come into the stock and if it persists, then it could be a good signal to trade on.
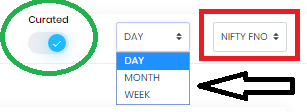
Curated Signal
There is also a function of using a curated signal, which puts the list thru a higher level of filtration and gives you smaller but higher probability candidates to choose from. There is also a choice where one can load the universe


Loading the universe:
Users can run our TWR pivot Algos on the universe of your choice. The first step would be to select the particular pre-defined universe from the dropdown box as shown. One can also create watch list of preferred stocks on which the Algo could be executed before being showcased for trading / investing.

TWR Levels :
On the top left of the page you have a selection for TWR levels(marked in red arrow) , this page shows all the levels for every stocks in our universe. The user can see the list of TWR levels for all stocks.
There is a search function(Red box) and a watch list and universe selection along with an option to pick multi time frames(Black box) to perform analysis on the users preferred time frame.
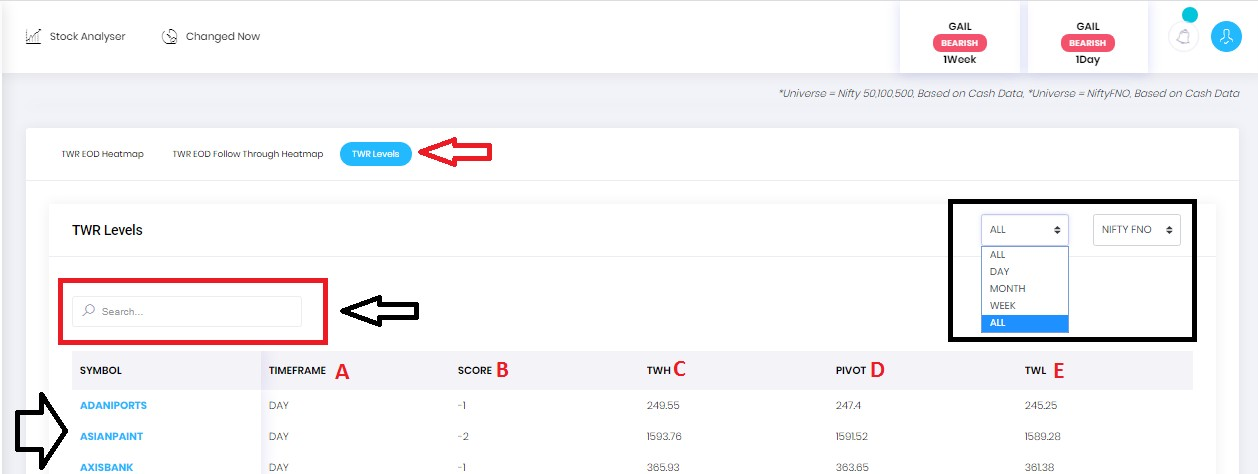
In the above pic you can see that the the results of various stocks are visible across many colums, there is a lettering done besides every column , which is explained more in detail below.
SYMBOL – Name of the stock
A – TIMEFRAME : Duration in which the data is being displayed .options are D/W/M – it can be toggled from the top right of the screen as seen in the black box.
B - Score : The TWR score for the particular stock in the selected time frame. Details of the score is mentioned in detail in the above section.
C – TWH – Trend Watch High – The upper end of the range which marks the highest point of the range.
D – Pivot – The level of the Pivot – which is the mid-point of the range.
E – TWL – Trend Watch Low - The lower end of the range which marks the lowest point of the range.
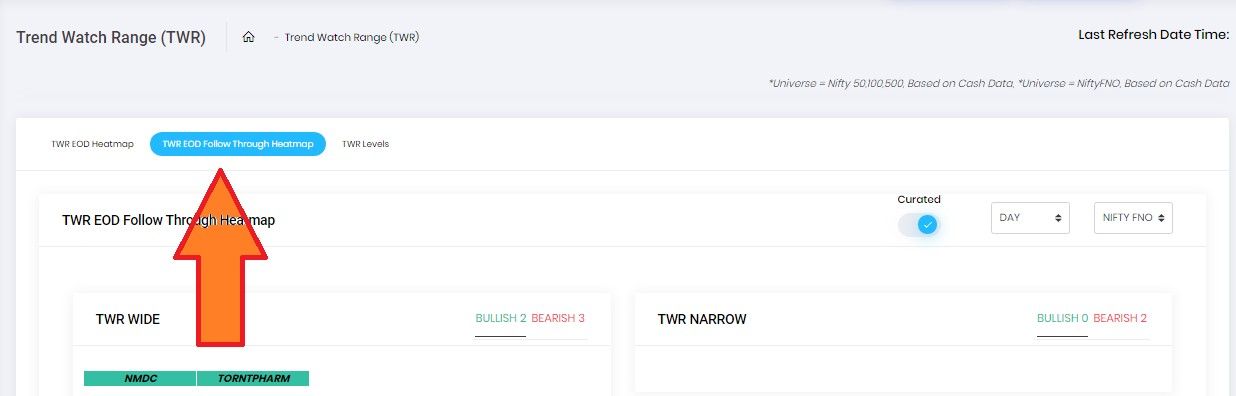
EOD Follow Through
This is available as the second selection on the top left corner of the page.
This page delivers results that have shown follow thru price action on the next day, it is marked on the red page. This page can come in handy in the opening hours of the market to check which stocks are showing continuation of the trend in the next day itself.
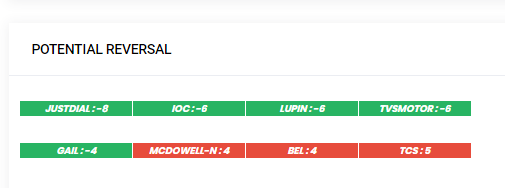
Potential Reversal
This is the last column on the right side of the heatmap
This lists down the prospective stocks which can reverse direction the next day. The ones in green have to potential to go up and the ones listed in red have the potential to go down.
This should be seen in line with the EOD follow thru page mentioned in the above section, the reversal candidates appearing should be vetted next day in the EOD follow thru page for confirmation of the trend.